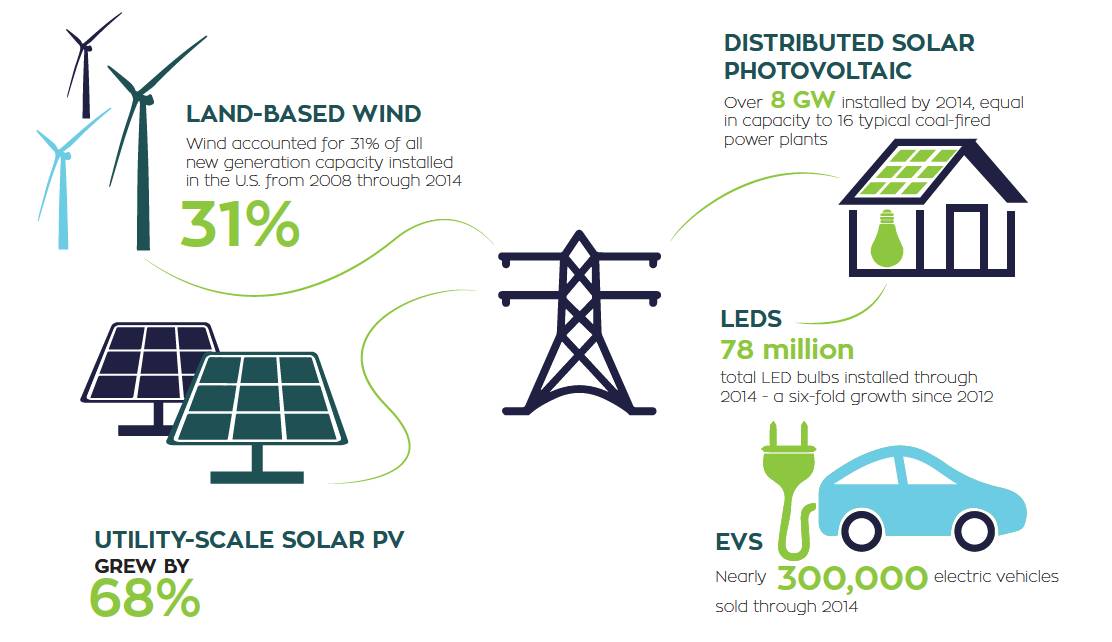
LAND-BASED WIND
Wind accounted for 31% of all new generation capacity installed in the U.S. from 2008 through 2014 31%.
UTILITY-SCALE SOLAR PV
GREW BY 68% in 2014 to 9.7 GW total — over 99% of this total has been installed since 2008.
DISTRIBUTED SOLAR PHOTOVOLTAIC
Over 8 GW installed by 2014, equal in capacity to 16 typical coal-fired power plants.
LEDS
78 million total LED bulbs installed through 2014 – a six-fold growth since 2012.
EVS
Nearly 300,000 electric vehicles sold through 2014.
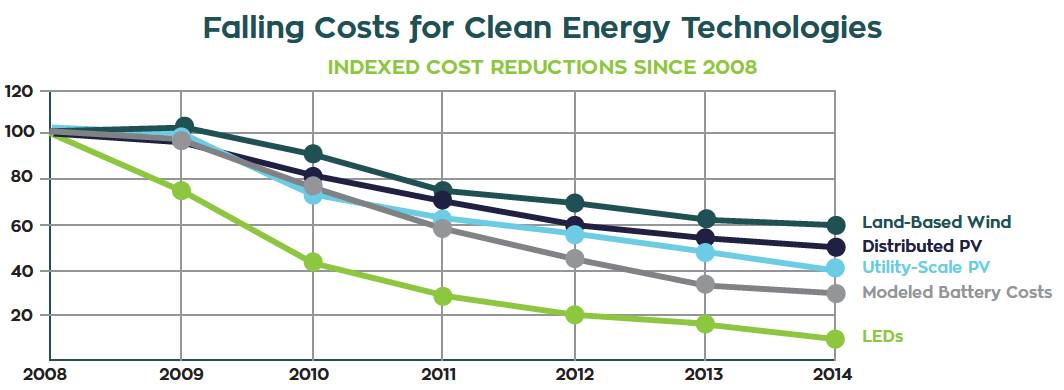
Falling Costs for Clean Energy Technologies
Wind
“Power purchase agreements for wind have fallen from rates up to 7 cents/kilowatt-hour (kWh) in 2009 to an average of 2.4 cents/kWh in 2014.”
Solar
“Between 2008 and 2014, the cost for a PV module declined from $3.57/watt (W) to about $0.71/W. The total cost of utility-scale PV systems fell from $5.70/W in 2008 to $2.34/W in 2014 — a decrease of 59 percent. This means solar is increasingly reaching cost parity with traditional electrical generation from natural gas and coal in parts of the United States.”